

 The USDA released its September 30 Grain Stocks report yesterday, reporting slightly higher bean stocks and less corn, leading corn to fall lower and beans to end slightly higher, due to the report data of 14 million bushels of beans lower than pre-report expectations.
At yesterday’s close, the December corn futures ended 1 1/4 cents lower at $3.87 ¾, while November soybean futures ended 7 3/4 cents higher at $8.92. Overall, the report showed corn stocks up 15 percent from June of 2014, and soybean stocks up 54 percent. In total, corn stocks were up 41 percent from September of 2014, and soybean stocks were up 108 percent.
Looking specifically at the numbers, old crop corn stocks in all positions as of September 1st, 2015 totaled 1.73 billion bushels. 593 million bushels of total corn stocks are being stored on-farm, up 28 percent from one year ago. Off-farm stocks are at 1.14 billion bushels, a number that is up 48 percent from one year ago. The June-August 2015 quarterly disappearance is at 2.72 billion bushels, compared with 2.62 billion bushels from the same time period last year.
The big news coming from the report stemmed from the soybean numbers.
Of the soybean market’s initial 18 cent rally following the report, and final ending of 8 cents higher for the day, DTN’s senior marketing analyst Darin Newsom argues, “The immediate reaction looked to be one of a market with an artificial ceiling finally removed.”
Old crop soybeans totaled 191 million bushels as of September 1st, a figure up 108 percent from one year ago. On-farm soybean stocks totaled 49.7 million bushels, up 133 percent from a year ago, with off-farm stocks at 142 million bushels, up 101 percent. Disappearance figures totaled 436 million bushels, up 39 percent from last year.
According to the report:
Based on an analysis of end-of-marketing year stock estimates, disappearance data for exports and crushings, and farm program administrative data, the 2014 soybean production is revised to 3.93 billion bushels, down 41.7 million bushels from the previous estimate. Planted area is revised down 425,000 acres to 83.3 million acres, and harvested area is revised down 470,000 acres to 82.6 million acres. The 2014 yield, at 47.5 bushels per acre, is down 0.3 bushel from the previous estimate.
Trade reaction to the release of the latest report numbers was predictable, although Kluis Commodities analyst Cory Bratland expects the numbers to be shrugged off quickly, and for the markets to resume trading based on harvest activity. Average trade guesses were quite similar to actual numbers for corn, even though they were lower than pre-report trade expectations, hence higher close.
Randy Martinson with Progressive Ag Marketing based in Fargo, N.D., does expect to see corn and soybean prices to see pressure due to the quick pace of harvest and higher-than-anticipated yields.
How is your harvest progress? Are you surprised by the latest Grain Stocks Report numbers? Feel free to contact UFARM with any questions or concerns you may have—we are glad to work with you to make the most of your farming operation. UFARM offers a full range of Nebraska land management services, including real estate sales, rural property appraisals, consultations and crop insurance. UFARM has operated in Nebraska since the early 1930’s. Contact us today!
Sources consulted: Howard, Fran. “Big Carryouts as Farmers Head Into New Crop Season.” Agweb.com. Farm Journal. 30 Sep. 2015. Web. 01 Oct. 2015. Newsom, Darin. “We’ve Seen This Show Before.” DTN The Progressive Farmer. DTN. 30 Sep. 2015. Web. 01 Oct. 2015. USDA. “Grain Stocks Report September 30, 2015.” National Agriculture Statistics Service. United States Department of Agriculture. 30 Sep. 2015. Web. 01 Oct. 2015.

On Tuesday, August 12th, the USDA released its latest World Agriculture Supply and Demand Estimates, and as usual, had some unexpected numbers for analysts and producers. Higher-than-anticipated yield estimates in both corn and soybeans resulted in lower grain prices for both crops.
Most of the pre-report analysis was based on the USDA’s latest weekly Crop Progress report, released just prior to the WASDE report, which rated the U.S. corn crop at 70 percent good to excellent, similar to the previous week’s rating. That similarity had many analysts expecting the USDA to release similar yield estimates as in July.
Other pre-report analyses had based their little-to-no change projections on the tough growing conditions that have plagued producers in the Eastern Corn Belt this growing season.
Looking at the numbers, for corn, the USDA estimated that 2015-16 corn yield at 168.8 bushels per acre vesus 166.8 bushels per acre in July and the average trade guess of 164.5 bushels per acre. As a result, the total US corn production increased to 13,686 million bushels, up 156 million bushels versus July estimates and 359 million bushels higher than the average trade guess.
For soybeans, the USDA had similar yield increase estimates, pegging the 2015/16 US soybean yield up to 46.9 bushels per acre. This is in comparison the 46 bushels per acre estimate in July, and the average trade guess of 44.7 bushels per acre. As a result, the US soybean carryout increasing to 470 million bushels, or 169 million bushels higher than the average trade guess. In turn, November soybean futures closed down 61 ½ cents per bushel.
As with corn, the pre-report analysis of similar estimates was based on poor growing conditions in certain parts of the country, and the crop condition report good-to-excellent rating of 63 percent, versus 70 percent one year ago.
Are the USDA’s numbers to be believed? Only time will tell, though the September WASDE report should have some actual harvest numbers to figure in. Analyst Marcus Ludtke of Commodity Marketing Co. firmly places himself in the skeptical camp regarding the latest WASDE estimates.
He writes,
“What’s potentially misleading about the USDA’s yield decreases relative to a year ago? 2014 was a record corn yield year for a number of states including the four states of IL, IN, MO, and OH. Illinois’s record yield in 2014 eclipsed the previous record by 20 bpa (previous record was 2004 – 180 bpa), Indiana’s by 11 bpa (2013 – 177 bpa), Missouri’s by 24 bpa (2004 – 162 bpa), and Ohio’s by 2 bpa (2013 – 174 bpa). Therefore 2014 in my opinion should almost be considered an outlier based on just how remarkable and unprecedented of a growing season it was. I don’t think it should be used as an accurate representation of trend of even slightly above-trend line yield potential.”
Ludtke similarly considers 2012 an outlier as well, due to the extreme drought that plagued the entire Midwest.
In light of those considerations, he hypothesizes: “If we’re to make any sort of sound comparison to the USDA’s yield estimates on Wednesday, I think we need to measure them versus the 4-year average corn yields from each of those states during 2013, 2011, 2010, and 2009.”
Until then, farmers will keep doing what they do best, and start preparing for harvest.
Source consulted: Ludtke, Marcus. “US Corn Weekly Update: August WASDE Rattles Market.” See It Market. See It Market. 13 Aug. 2015. Web. 20 Aug. 2015.
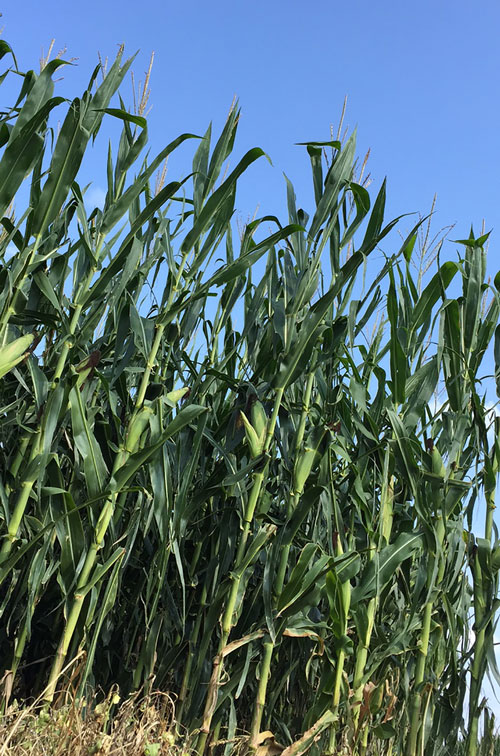
Hail Damaged Corn in Northeast Nebraska
When it comes to important growing milestones, July is an important month, especially for corn. The USDA released its weekly crops progress report on Monday. How are things looking for Nebraska crops, as well as for crops across the Midwest?
The good news is that, after a slow start to planting season and early on due to excess moisture, the progress is picking up. Both corn and soybeans have made decent strides over the last several weeks, though they are still behind last year’s data.
Overall, the USDA rated the corn from the 18 top corn-growing states as 70 percent good/excellent. This is improved from last week’s 69 percent, but behind the five-year good/excellent average of 75 percent.
Another area where corn made great strides from last week was in corn silking—a critical stage of development. This week, the USDA found that 78 percent of the nation’s corn crop is silking, versus 55 percent a week ago. Similarly, 14 percent of that crop is in the dough stage, slightly behind the five-year dough stage average of 17 percent.
Nationwide, for soybeans, the USDA rated the crop as 62 percent in good/excellent condition, which is equal to last week, but behind last year’s 71 percent.
As for important soybean developmental milestones, nationwide, 71 percent have bloomed, slightly behind last year’s 74 percent, and only one percentage point behind the five-year average for soybean blooms at this time.
In comparison with the nationwide crop numbers, how are Nebraska crops doing?
Fortunately, for the week ending July 26th, the state experience near normal temperatures statewide. Southeast portions of the state received up to four inches of rain, while the rest of the state’s moisture totaled 1 inch or less. The combination of favorable weather and moderate rainfall facilitated crop development, although some areas with less moisture are reported dryland stress symptoms. The NASS reported 6 days suitable for fieldwork, with topsoil moisture supplies rated at 6 percent very short, 24 short, 66 adequate, and 4 percent surplus.
For Nebraska corn conditions, 74 percent rated as good/excellent, better than the nationwide rating of 70 percent. This is ahead of last week’s 69 percent, but behind last year’s 75 percent.
Nebraska corn silking was at 83 percent, ahead of the nationwide average of 78 percent. This is one percentage point ahead of last year’s 82 percent, as well as the five year average of 82 percent.
Similarly, Nebraska soybeans are faring better than the total 18 state average as well, with 72 percent as good/excellent. This is one percentage point ahead of last year’s 71 percent good/excellent rating. Nebraska soybean blooming rate was at 77 percent, which is behind last year’s 82 percent, but near the 78 percent average.
Will the favorable conditions hold into August? Only time will tell. As of now, Nebraska crops are doing well. UFARM land managers are on the ground in Nebraska fields throughout the growing season, and can keep you updated on the latest conditions.
UFARM offers a full range of Nebraska land management services, including real estate sales, rural property appraisals, consultations and crop insurance. UFARM has operated in Nebraska since the early 1930’s. Contact us today!
Sources consulted: “Nebraska Crop Progress and Condition.” USDA. United States Department of Agriculture National Agricultural Statistics Service. 27 Jul. 2015. Web. 28 Jul. 2015.

Wet weather across the Midwest continues to curb crop progress—both planting and growth. The two USDA reports released this week, Crop Progress on Monday, June 29th, and the Planted Acres report on Tuesday, both reflected the effects of the overabundance of precipitation. It continues to create problems for farmers, and crop conditions have substantially deteriorated in the final two weeks of June, according to the USDA.
The grain markets have responded accordingly. July corn prices increased 18.3 percent in June and closed at $4.14 per bushel, and the July soybean contract price increased 13.4 percent throughout June to close at $10.56 per bushel. Looking at the Crop Progress report numbers, the USDA estimated that as of June 28th, corn conditions stood at 68 percent as excellent/good, a 3 percent decrease from the previous week and a 12 percent decrease from last year. 24 percent of the crop was reported as fair, a 1 percent increase from the week prior, but a 4 percent increase from last year. 8 percent was rated as poor/very poor, a 2 percent increase from the week prior.
Soybean conditions showed similar estimates, with 63 percent rated excellent/good, a 2 percent decrease from the previous week, and a 9 percent decrease from last year. 28 percent of the crop was rated as fair, a 1 percent increase from one week prior, while 9 percent of the crop was rated as poor/very poor.
Looking specifically at Nebraska numbers, corn condition rated 1 percent very poor, 5 poor, 24 fair, 58 good, and 12 excellent. Corn silking was at 1 percent, equal to last year, and near the five-year average of 4.
Nebraska soybean conditions rated 1 percent very poor, 7 poor, 24 fair, 57 good, and 11 excellent. Soybean emergence was at 92 percent, behind 100 last year and 99 average. Blooming was at 10 percent, behind last year’s 20 percent, but near the 9 percent average.
The overabundance of precipitation was also reflected in the USDA Stocks and Acreage report released June 30th, as stocks and acres planted came in below analyst expectations. Specifically, the USDA put U.S. corn acreage at 88.9 million, versus the trade expectation of 89.3 million and its March estimate of 89.2 million. Similarly, soybean plantings have been estimated at 85.1 million acres, this versus the analysts’ estimate of 85.2 million acres and 84.6 million acres in March.
For stocks, the USDA report showed 4.47 million bushels versus the analysts’ estimate of 4.555 billion bushels and the stocks estimate of 3.852 billion bushels of last year at this time.
Soybean stocks, too, were reported as lower than previously expected, with June stocks totaling 625 million bushels, versus the expectation of 670 million bushels and last year’s 405 million bushels.
Overall, despite the headaches that the excess precipitation is causing for some, the positive grain market response is welcome news to farmers. Will the bullish market continue? Much will depend on the weather.
UFARM offers a full range of Nebraska land management services, including real estate sales, rural property appraisals, consultations and crop insurance. UFARM has operated in Nebraska since the early 1930’s. Contact us today!
Sources consulted: McGinnis, Mike. “Trade Responds to USDA Bullish Data.” Agriculture.com. Meredith-Agrimedia. 30 Jun. 2015. Web. 01 Jul. 2015. Schober, Marc. “Grains Rally in Wet June Weather.” Agweb.com. Farm Journal. 01 Jul. 2015. Web. 01 Jul. 2015.
After a quick start, corn and soybean producers across Nebraska and the nation are barred out of the fields to complete their last acres of planting, courtesy of a rainy, cool weather pattern. The latest weekly USDA crop progress report, postponed by one day due to the Memorial Day holiday, reflected this slowdown, both for Nebraska farmers and those in the 18 other states reported on.
Despite the slowdown, the nation’s crop producers are still ahead of the previous average, and emergence for both corn and soybeans made great bounds in the last week, according to the report numbers.
Taking a closer look at the national corn numbers, as of the week ending Sunday, May 24th, 92 percent of the nation’s corn crop is in the ground, up 7 percent from the previous week, and still ahead of the normal pace by 5 percent. Corn emergence stands at 74 percent, up considerably from 56 percent a week ago. Emergence now sits 12 percent ahead of the normal pace for this week of the year.
For beans, 61 percent are planted, up from 45 percent a week ago, and 6 percent ahead of the previous average pace. Beans have made great gains over the last week, as well, with emergence for the crop at 32 percent, up nearly 20 percent from the previous week and 7 percent ahead of normal pace.
Looking specifically at Nebraska numbers, the report showed corn planted at 92 percent as well, compared with 96 percent last year and 96 percent for the five year average. Corn emergence stood at 73 percent, compared to 70 percent last year, and ahead of the 67 percent average.
For Nebraska beans, farmers have 59 percent in the ground, largely behind last year’s 85 percent, as well as the 73 percent five year average pace. Soybean emergence was at 22 percent, also behind last year’s 38 percent and the 31 percent average.
This should come as no surprise, as the state has face cool, wet weather that has prevented planters from entering the fields. According to the latest report:
“For the week ending May 24, 2015, cloudy, wet conditions hampered spring planting activities with an inch or more of rainfall common in the western half of the state. Temperatures were again cool, and averaged six to eight degrees below normal.”
While it’s not a problem to have adequate moisture for emerging crops, too much coupled with long durations of cloudy weather can cause problems. Many producers are reporting yellow corn in the state. A WCMO listener stated, “A lot of acres here [are] looking under the weather in south-central Nebraska. Way too much cloudy, drizzly weather. Starting to see chemical damage in corn from not being able to metabolize the chemicals. A lot of the corn has bad color. Some beans have been in the ground for almost 2 weeks and haven’t emerged yet.”
The weather forecast across the northeast, north central and south central parts of the state predict yet more rain chances in the coming days, coupled with cloudy weather. Farmers will be on the lookout for sun and a chance to get those last few acres in the ground.
UFARM offers a full range of Nebraska land management services, including real estate sales, rural property appraisals, consultations and crop insurance. UFARM has operated in Nebraska since the early 1930’s. Contact us today!
Sources consulted: Caldwell, Jeff. “Corn Planting at 92%, Soybeans at 61% as Midwest Weather Sours.” Agriculture.com. Meredith Agrimedia. 26 May 2015. Web. 27 May 2015. USDA. “Crop Progress Report for the Week Ending 5/24/15.” USDA.com. United States Department of Agriculture. 26 May 2015. Web. 27 May 2015.
 Tuesday, March 31st, farmers and market analysts focused their attention upon the USDA’s Prospective Plantings report for 2015, and while the numbers were within close distance of pre-report estimates, the amounts of prospective planting acres for corn and soybeans were farther apart than many had expected. Overall, the report numbers were bearish for new-crop corn, bullish for new-crop soybeans, and neutral for new-crop wheat.
Getting right to the numbers, the report estimated that farmers in the US will plant 89.2 million acres of corn during the upcoming planting season, a number that is down 2 percent from last year. Farmers will plant 84.6 million acres of soybeans, up 1 percent from one year ago. Overall, soybean acres will be higher in 21 of 31 major states for the crop.
As for the other portion of the report, Grain Stocks estimates showed 11 percent more corn supplies in the US versus that of one year ago, with 4.38 billion bushels stored. This is a 13 percent increase from one year ago. Consequently, corn stocks took a tumble yesterday, ending 18 cents lower by the end of the day.
Conversely, the report showed soybean stocks on hand to be at 1.333 billion bushels, slightly below the pre-report estimate of 1.341 billion bushels. As a result, soybeans ended up 3.75 cents yesterday.
For wheat, the report found quarterly wheat stocks at 1.124 billion bushels, also below the average pre-report estimate of 1.143 billion bushels. As for wheat acres, there were few surprises, with a report estimate of 13 million acres, compared to pre-report estimate of 13.24 million acres.
So, while the report wasn’t too far off expectations, farmers are still looking at lower corn prices for the foreseeable future. According to market analyst and broker Don Roose, “Tuesday’s grain stocks and numbers for both corn and soybeans, and their implications for overall acreage and stocks heading into the remainder of 2015, will be what takes charge of prices beyond planting season.” Next, the market’s attention will be focused on the weather, and at this point, it’s looking more favorable for the Midwest, and delayed in the mid-South and Delta.
“Right now, the outlook is for mild, below-normal temperatures in much of the Midwest, at least to start summer. That will benefit early crop development, though areas that are already on the dry side could stay that way, with rainfall prospects expected to be at or below normal through much of the summer in the Plains and Midwest,” says MDA Weather Services senior ag meteorologist Kyle Tapley.
Are you concerned about falling market prices, and wonder if your land is being put to its best use? Please feel free to contact a UFARM representative. We are glad to help.
Sources Consulted: Caldwell, Jeff. “Grain Stocks, Acreage Reports Send Corn Lower, Soybeans Higher.” Agriculture.com. Meredith Agrimedia. 31 Mar. 2015. Web. 01 Apr. 2015. Caldwell, Jeff. “Three Things to Watch This Morning, Wednesday, April 1st.” Agriculture.com. Meredith Agrimedia. 01 Apr. 2015. Web. 01 Apr. 2015. Newsom, Darin. “A Cliffhanger of Sorts.” DTN/The Progressive Farmer. DTN. 31 Mar. 2015. Web. 01 Apr. 2015.
 While the release of the USDA’s latest World Agricultural Supply and Demands Estimates report on Tuesday had many hoping for an uptick in grain prices, the grain market decided to go lower by the day’s close, throwing many farmers and analysts for a loop.
Despite overall bullish numbers for domestic corn and soybeans, though less so for wheat, an expected record harvest in South America and projection of another record setting harvest in US fields this coming fall prevented the grain markets from reflecting those numbers.
Looking closer at the numbers, for US corn, the ending stocks estimate was lower than expected at 1.827 billion bushels. This is in large part thanks to a 75 million bushel increase in ethanol production. Lower gas prices have driven up demand for gas and ethanol, and have therefore kept the pace for ethanol production. Worldwide, the USDA estimated a 4.2 million metric ton increase in world corn demand, which offset the increased estimate of corn stocks modest production increases in Argentina and Ukraine more than enough to keep the world-wide report numbers for corn neutral to bullish.
For US soybeans, the US stocks estimate was lower than expected, at 385 million bushels. Similarly, the USDA’s estimate of world soybeans stocks was also lower than expected, at 89.26 million metric tons. This was aided by a 2.3 million metric ton increase the USDA’s estimate of world soybean demand. When these numbers are taken into account in light of pre-report expectations, they are neutral to bullish as well. However, traders took the record South American soybean harvest expected, and thus the markets reacted contrarily to what many expected based solely on the report numbers.
In wheat, the USDA’s report was bearish for both domestic and world supplies, with the domestic export numbers at 900 million bushels, down from 925 million bushels. This resulted in ending wheat stocks of 692 million bushels. Even though the USDA increased its estimate for world demand by 1.4 million metric tons, increased beginning stocks coupled with increases in production worldwide pushed estimates up more than expected, and wheat ended down 8 cents by the end of the day.
While some adopt a more pessimistic long-term view of the grain markets rallying, market analyst Bob Linneman of Kluis Commodities adopts a more sanguine attitude, and asserts that if crude oil begins an assent, grains will follow suit:
“Now that the USDA report has come and gone, I think grains have a chance to rally if oil can close above last week’s high of $54.24. The seasonal pattern for crude oil is higher through the first week of April. Although this pattern has not been accurate the past few months, if a rally is underway, then I want to watch the first week of April for an extreme to indicate that the seasonal pattern is back on track.”
Are you concerned about how the grain markets will affect your cropping decisions during the coming growing season? Contact a UFARM specialist; we are here to help.
Sources consulted: Caldwell, Jeff. “WASDE numbers fail to rally grains as prices slip into Wednesday.” Agriculture.com. Meredith Agri Media. 11 Feb. 2015. Web. 11 Feb. 2015. Hultman, Todd. “USDA Report Head Scratcher: Those are Bullish USDA Estimates?” DTN The Progressive Farmer. DTN. 10 Feb. 2015. Web. 11 Feb. 2015.
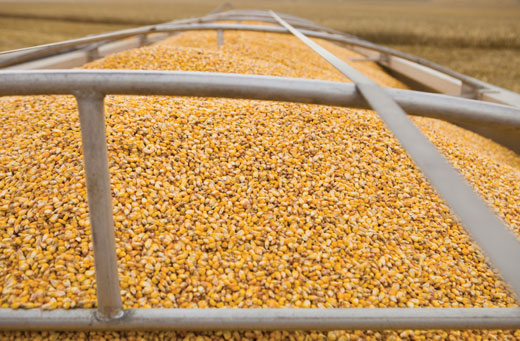 While it’s no secret that the main component of farm profitability involves producing a good crop with the greatest efficiency and lowest cost of production, it’s also true that marketing that crop plays a significant role in profitability as well. While farmers and landowners may differ in their individual marketing style, it’s important that they identify and employ a grain marketing strategy that works for them.
A study by the Kansas State University Extension Cooperative identified four main grain marketing strategies that are typically used by producers: routine strategies, systematic strategies, strategies based on individually generated forecasts, and strategies based on market-generated forecasts of production profits.
With routine strategies, there are little to no surprises; the producer makes grain marketing decisions at the same time of year using the same marketing tools regardless of market conditions. In this way, once the marketing decisions have been made, little to no further input is needed, and marketing decisions become rather automatic.
Systematic strategies base decision making on key market indicators and allow for year to year variations in marketing actions. A producer employing a systematic marketing strategy pays attention to the key market indicators and what they’re doing based on the market conditions for that time period, and makes decisions accordingly.
Some producers are able to market their crops year to year based upon their own individually generated marketing forecasts, owing to superior access to market information or background experience in the marketing field. These producers are able to consistently profit by basing their marketing decisions upon their own market forecasts.
The last grain marketing strategy involves basing marketing decisions upon market-generated forecasts of production profits. This is done by using futures and options prices as a basis for production and marketing decisions. Examples include storing grain for postharvest sale when the harvest basis levels are wider than normal, or by hedging grain futures when preharvest grain forecasts are signaling higher than normal profits, and avoiding hedges when they are signaling lower than normal profits. This strategy, according to the KSU study author, “is based on anticipating the crop acreage responses of the collective group of grain producers to either high or low expected profits from a crop enterprise, and the subsequent change in production and subsequent prices that will occur the following harvest. Higher than normal preharvest hedging profits will give an incentive to crop producers to increase crop acreage and associated production, leading to lower prices by the following harvest.”
Determining which of the above grain marketing strategies is right for your operation depends on a number of factors, such as your individual marketing style and temperament—including your attitude toward price risk, the existing financial state of your farming operation, your grain storage availability, and your familiarity with markets and marketing tools.
Identifying your main marketing goals with the factors listed above in mind will help you to determine which grain marketing strategy is the right fit. Whether it’s price enhancement or price risk reduction, having a good marketing strategy in place can help your bottom line and your peace of mind.
If you have questions or concerns about the marketing strategies available to you, feel free to consult a UFARM manager to help point you in the right direction.
Sources consulted: O’Brien, Daniel. “Grain Marketing Plans for Farmers.” Kansas State University. Kansas State University Agricultural Experiment Station and Cooperative Extension Service. Jul. 2000. Web. 26 Jan. 2015.
Lincoln, Nebraska
402-434-4498
Kearney, Nebraska
308-237-7662
Norfolk, Nebraska
402-371-0065
North Platte, Nebraska
308-532-4991

